The sharp drop in Bitcoin to $106,200 on the eve of Halloween scared the market, causing the price to fall by almost 5% in a few hours. However, a rebound followed just as quickly — a rise of almost 4%, bringing the price back above $108,700.
For many traders, this looked not just like a flash of volatility, but a planned ‘shakeout’ aimed at removing weak participants and resetting the market structure before a new impulse.
The drop may have reset the short-term market structure
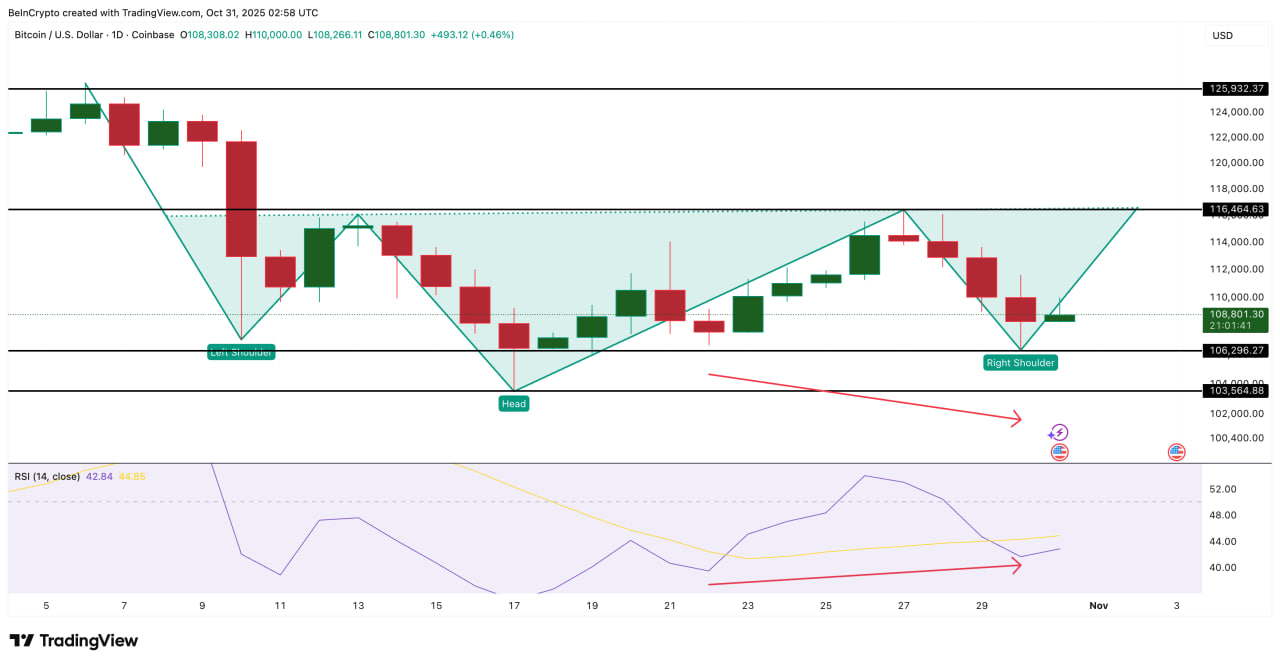
After the crash, the Relative Strength Index (RSI), which measures the balance between buying and selling, remained stable despite new local lows between October 22 and 30. Such a gap between price and RSI often indicates a bullish divergence — a signal that selling pressure is weakening and buyers are starting to regain control.
The chart also shows an almost completed ‘inverse head and shoulders’ pattern — a classic reversal figure. The latest price drop helped form the right ‘shoulder’. To confirm a reversal, Bitcoin needs to consolidate above $116,400 — breaking this neckline could start a new upward impulse.
Indicators confirm market cleansing
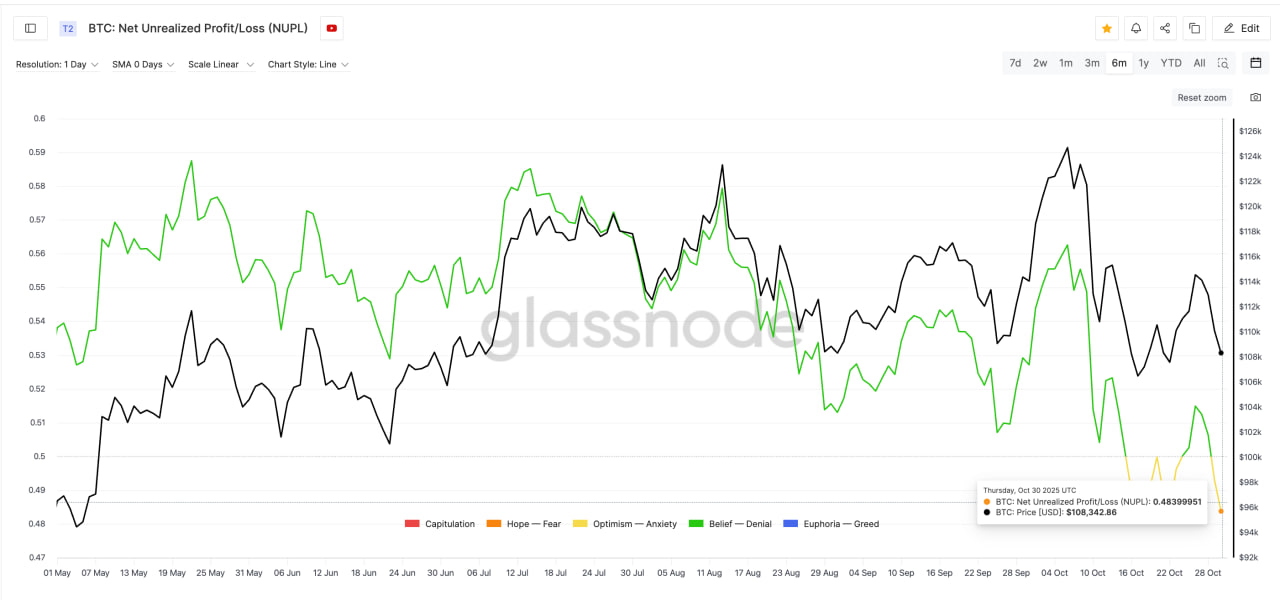
Glassnode data on the Net Unrealized Profit/Loss (NUPL) metric, which shows the share of investors in profit or loss, fell to 0.483 — one of the lowest levels in the past six months. Such values are seen when weak hands leave the market and long-term holders continue to accumulate positions.
The last time NUPL dropped to these levels was on October 17, when Bitcoin rose by 7.6% — from $106,498 to $114,583. This strengthens the view that the current drop was another ‘flush’ of short-term speculators and a foundation for a new local rally.
The $111,000 level is key to confirming the rebound
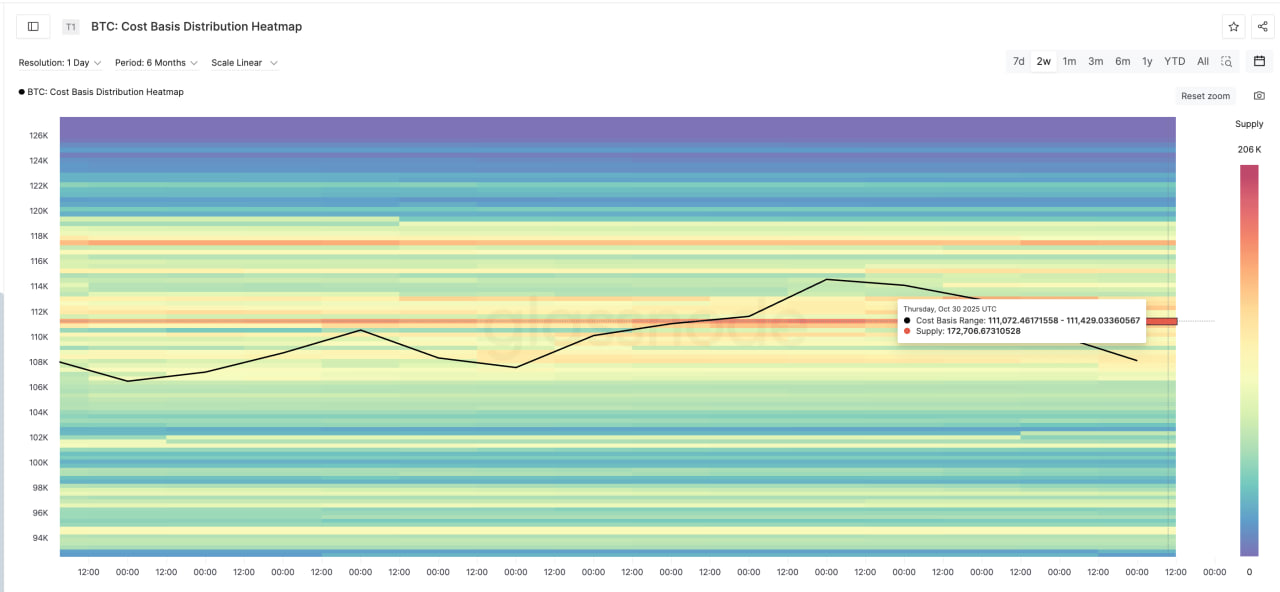
The main test of buyers’ strength is now concentrated in the $111,000–$111,400 range. According to Cost-Basis Heatmap, the largest number of previously acquired coins is concentrated here — about 172,700 BTC, which is approximately $18.8 billion.
This range represents the first serious resistance that Bitcoin must overcome to confirm a reversal. A successful breakout above $111,000 will signal further growth and open the way to the next resistance zones.
Possible scenario: breakout or false move
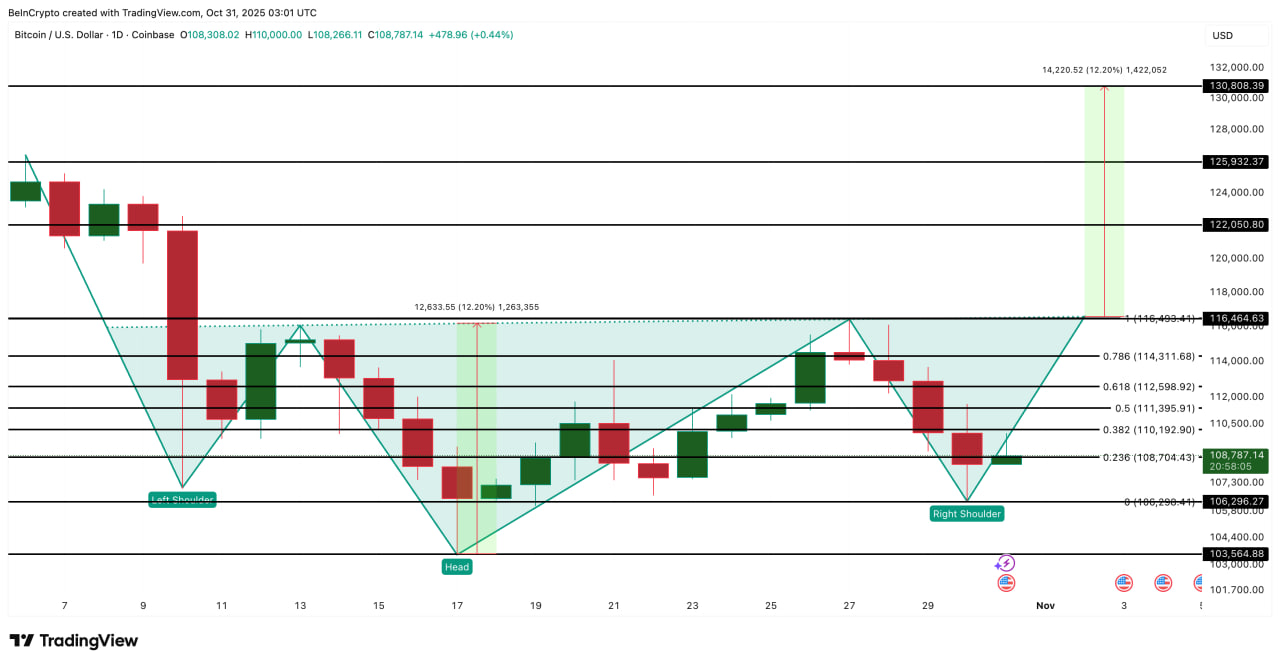
If Bitcoin consolidates above $116,400, this will confirm the completion of the bullish reversal pattern and open the way for a 12% rise, targeting around $130,800. This will be a new local high and strengthen investor confidence.
The nearest intermediate target is the $125,900 area, where partial profit-taking is possible. However, a drop below $106,200 will cancel the bullish scenario and could lead to a decline to the $103,500 zone, signaling the need for a longer stabilization before a new upward move.
What’s next?
The Bitcoin market is once again showing classic dynamics: a sharp drop, a shakeout of speculators, and gradual recovery. Taking into account technical signals and NUPL data, the October drop may not be the end of growth, but preparation for a new impulse.
If the price consolidates above $111,000 and confirms a breakout of the $116,400 line, the market could see an acceleration of the uptrend in November — up to the $125,000–130,000 levels.
Read more: Bitcoin ends October with a drop for the first time in seven years: investors await what November will bring


