Bitcoin started November with a 2% drop, once again falling to $107K. Despite hopes for seasonal growth, the asset is showing weakness, and on-chain data points to a possible decline below the key support at $100K.
Pressure is mounting
After closing the daily candle, Bitcoin sharply dropped, completely erasing the weekend’s gains. According to Cointelegraph Markets Pro and TradingView, the BTC/USD pair returned to the $107K level, raising concerns among traders.
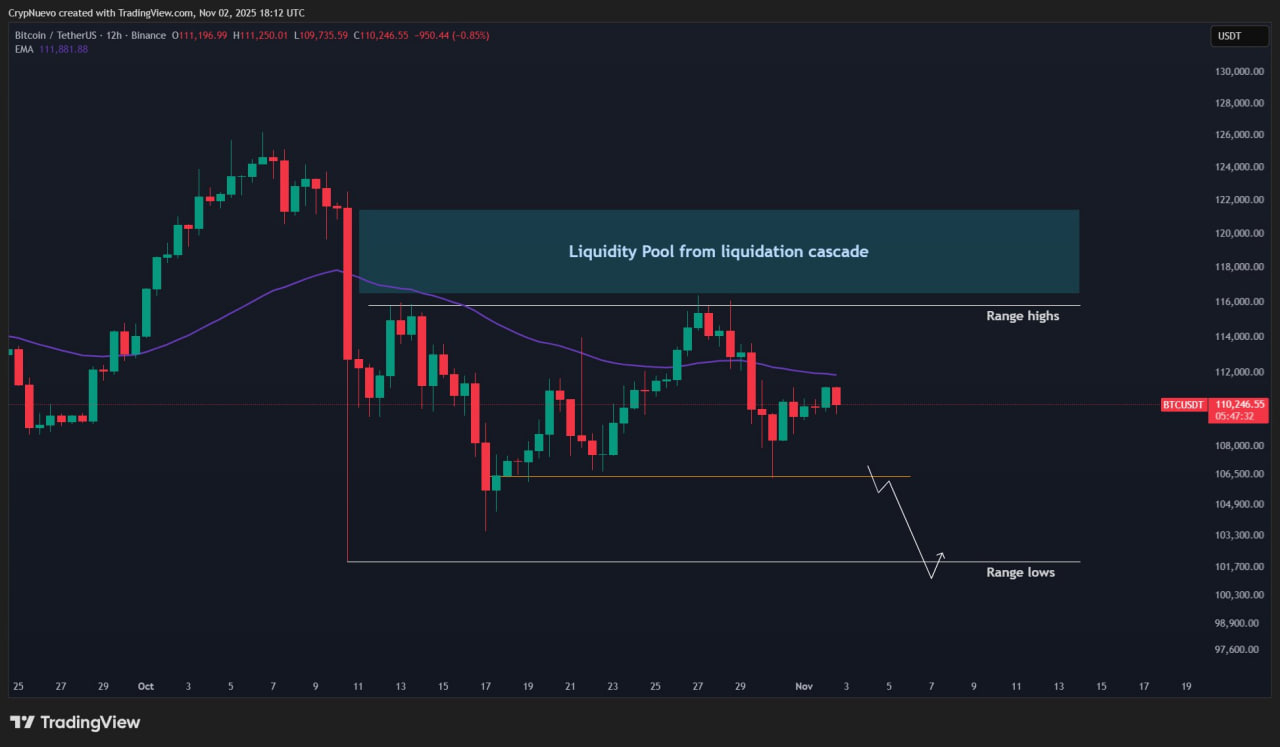
Trader CrypNuevo on X stated that this week could be ‘one of the toughest in the fourth quarter.’ According to him, the market could get stuck in a range, with a risk of retesting the lower boundaries at the 50-week EMA ($101.1K). This area previously acted as solid support during the crash from $126.2K in October.
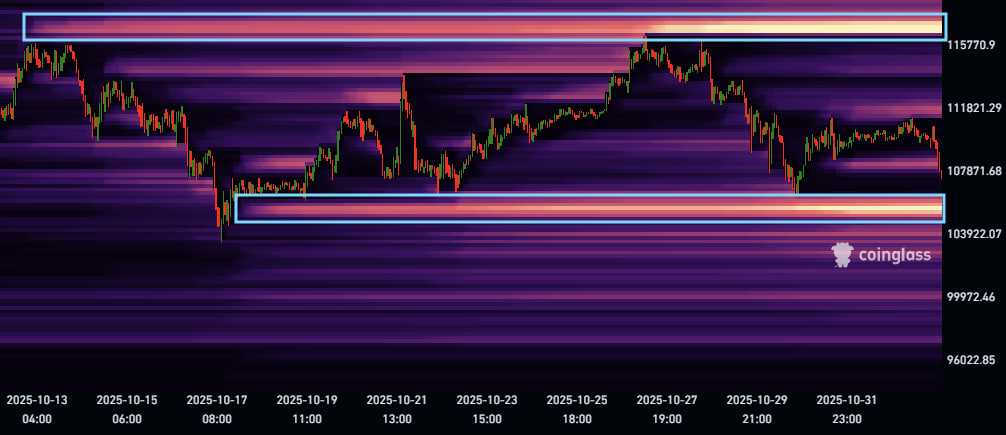
BTC order book
Other market participants, including Daan Crypto Trades, note important liquidity levels at $105–106K and $117K. Trader Mark Cullen adds that the decline could continue if large players decide to take advantage of ‘thin liquidity’ below current prices.
November falls short of expectations
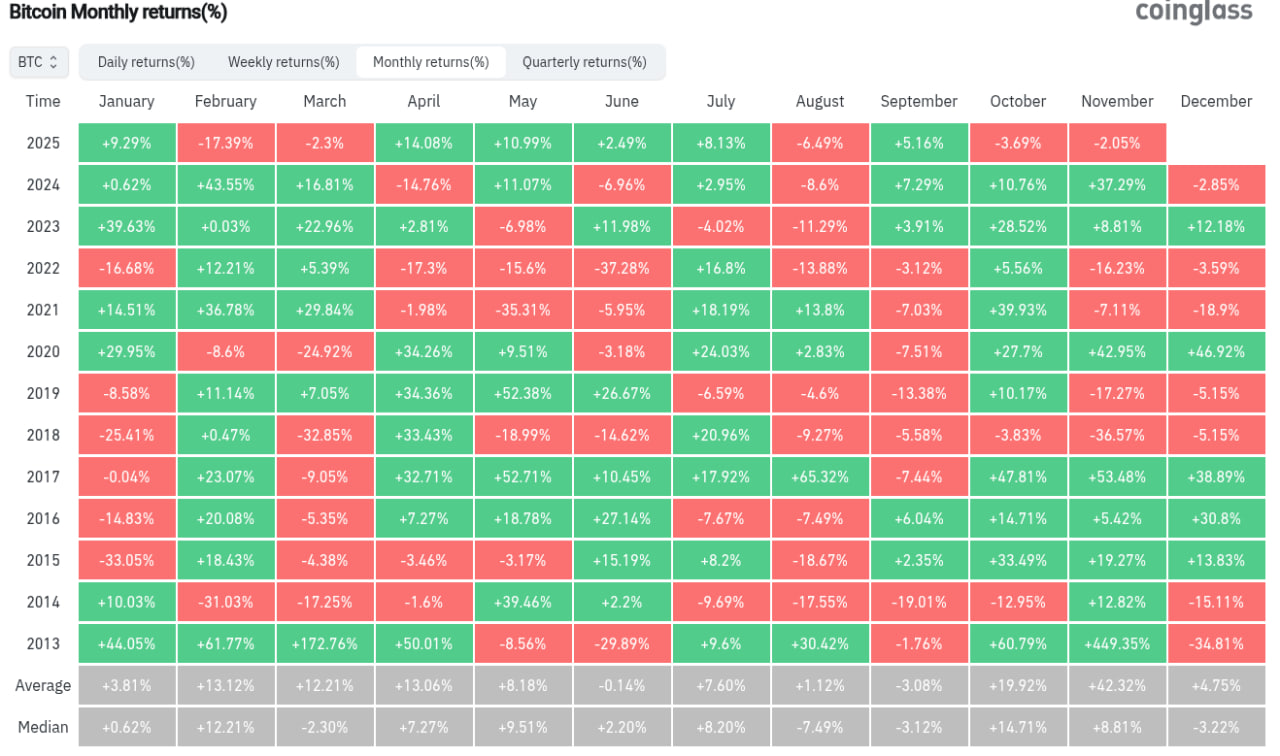
Historically, November brought strong results for Bitcoin — the average gain since 2013 exceeds 40%. But this year the situation is the opposite: since the beginning of the month, the asset has already lost about 2%, and October was the worst in the last seven years.
The CoinGlass platform notes that the probability of BTC rising above $120K according to Polymarket is only 33%, and closing the month above $115K is 60%. The Fear and Greed Index remains in the ‘fear’ zone, not reflecting the depth of the current decline.
Santiment analysts remind that when there are strong expectations of a drop, the market often moves in the opposite direction. ‘The fear phase may lead to a short-term rebound,’ the company said.
Stocks rise, Bitcoin stands still
Optimism around the US-China trade agreement supports the stock market. S&P 500 futures opened higher after reports of tariff reductions and lifting restrictions on rare earth materials.
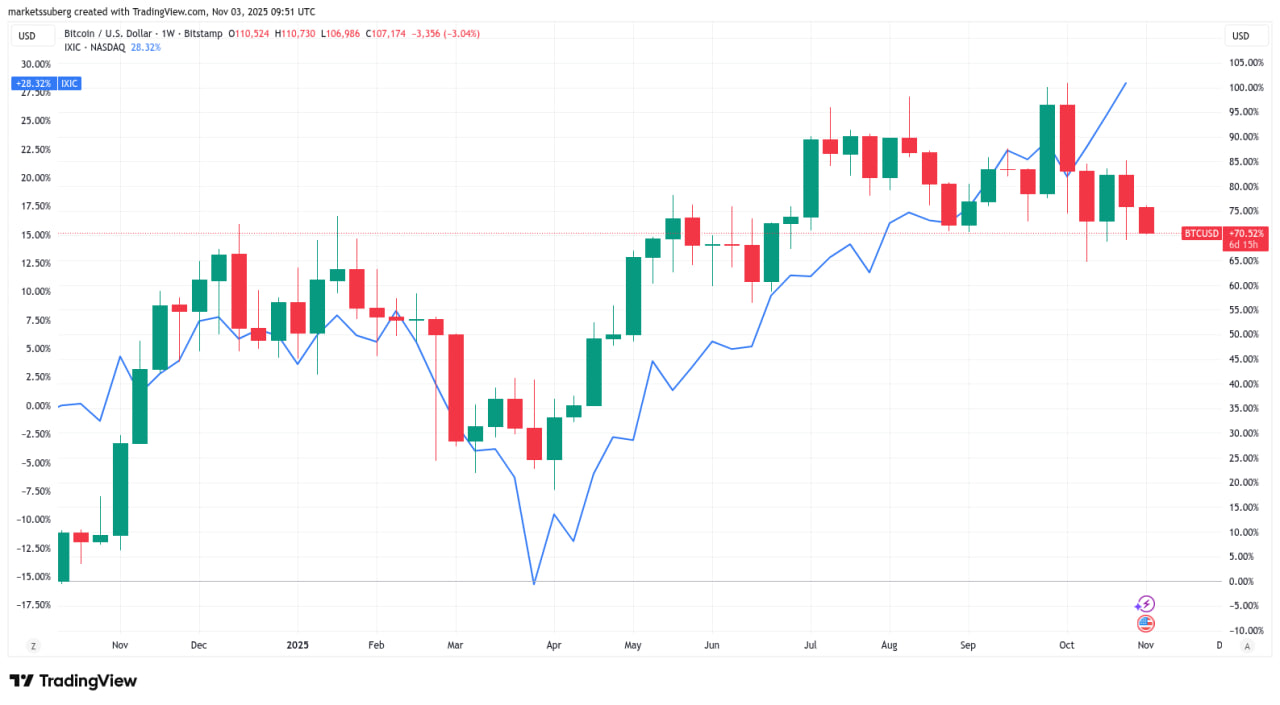
Traders from The Kobeissi Letter called this ‘the biggest de-escalation in recent times.’ However, cryptocurrencies remained on the sidelines: BTC’s correlation with Nasdaq weakened, and investors switched to a wait-and-see mode.
BTC correlation chart with NASDAQ
Macro analyst Jordi Visser noted that ‘Bitcoin no longer moves in sync with tech stocks.’ According to him, the correlation finally broke down back in December 2024.
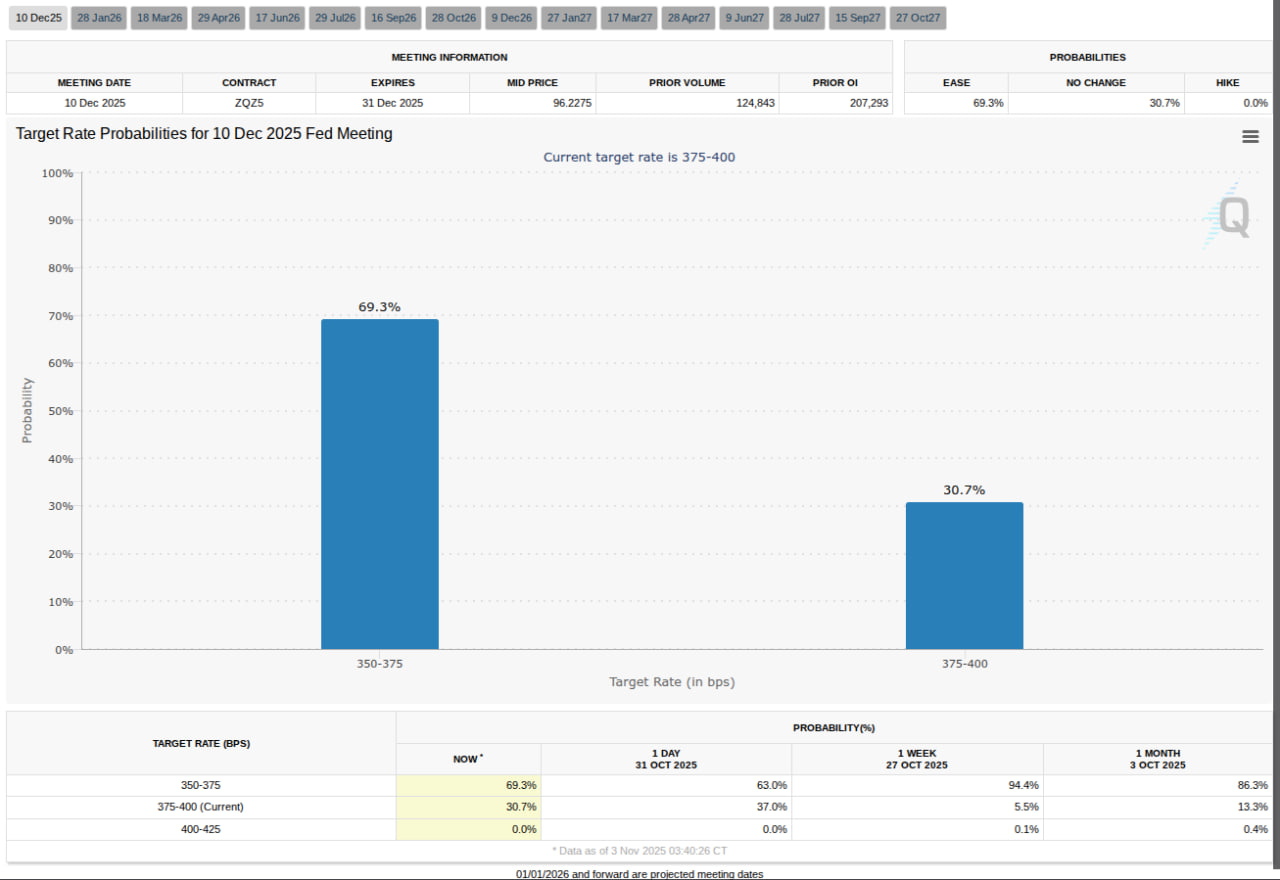
Amid a lack of new macro data (due to the US government shutdown), market participants’ attention is shifting to the Fed’s rhetoric. The probability of a rate cut in December is estimated by CME Group at 63%.
Mosaic Asset Company believes that ending the quantitative tightening (QT) program could be a positive factor. Since 2022, the Fed’s balance sheet has shrunk from $9 trillion to $6.5 trillion, and its stabilization ‘will relieve liquidity pressure on the markets.’
Institutional demand is falling
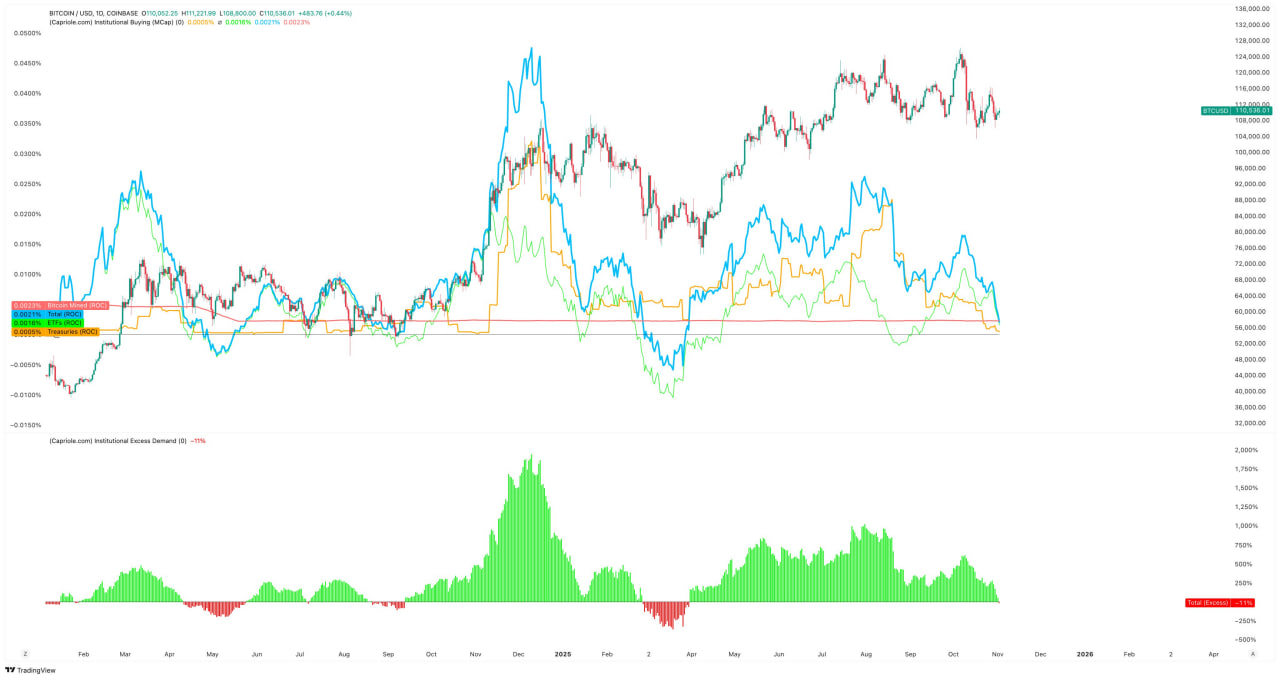
Data on institutional demand for Bitcoin
ETF funds record net outflows for the third day in a row. According to Farside Investors, by October 31, more than $500 million had left US spot Bitcoin ETFs, half of which were sales of BlackRock iShares Bitcoin Trust (IBIT).
Analyst Charles Edwards from Capriole Investments noted that for the first time in seven months, institutional purchases were below the volume of new mining. This is a signal of weakening demand from large players.
The last time this was observed was in April, before BTC fell to $75K. Edwards called the situation ‘negative,’ although he noted that ETFs still remain a driver of the market’s long-term maturity.
‘Today, Bitcoin is liquid enough for large players to exit positions without crashing the price. This was not the case before,’ he added.
Retail investors are leaving the market
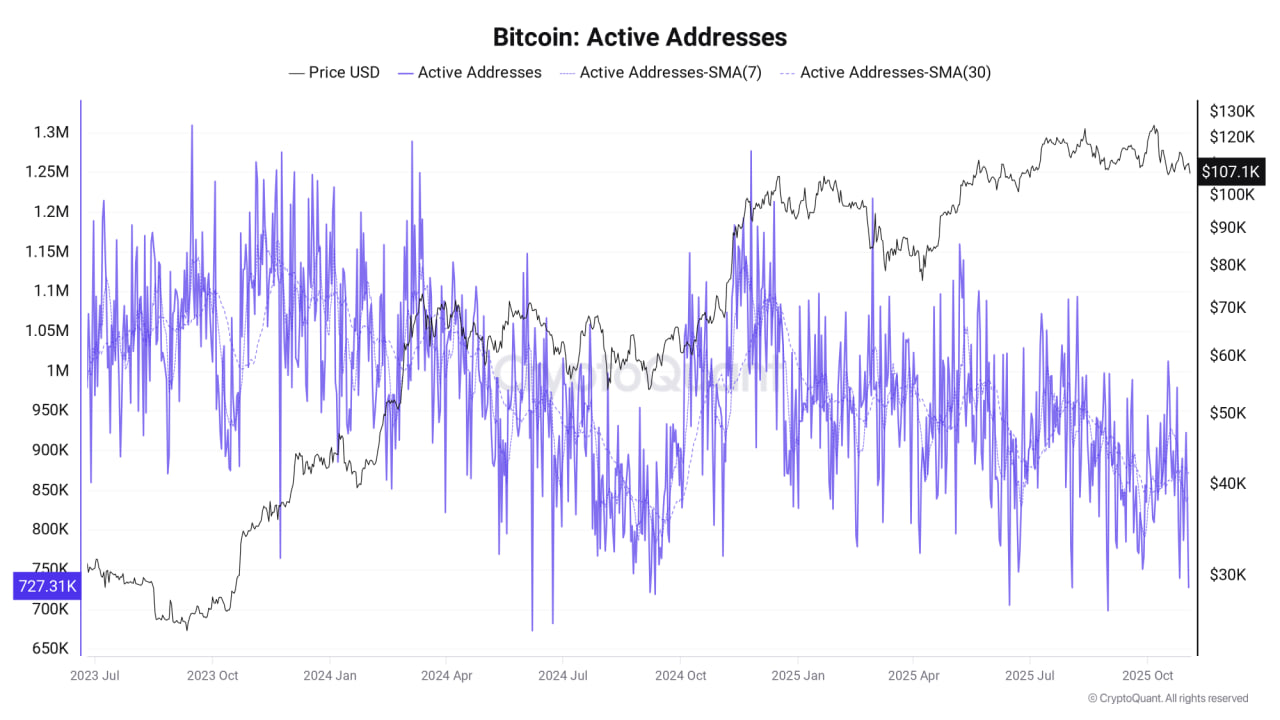
Amid a 20% drop from October highs, retail investor activity has noticeably decreased. According to CryptoQuant, the number of active addresses dropped from 1.18 million in November 2024 to 872,000 by the end of October 2025. That’s minus 26%.
Analyst Carmelo Aleman links the decline in interest to a series of liquidations and the ‘crowd leaving.’
‘Without retail, the market loses momentum and cycles get longer. It is retail investors who create the liquidity needed for large participants to take profits,’ he explained.
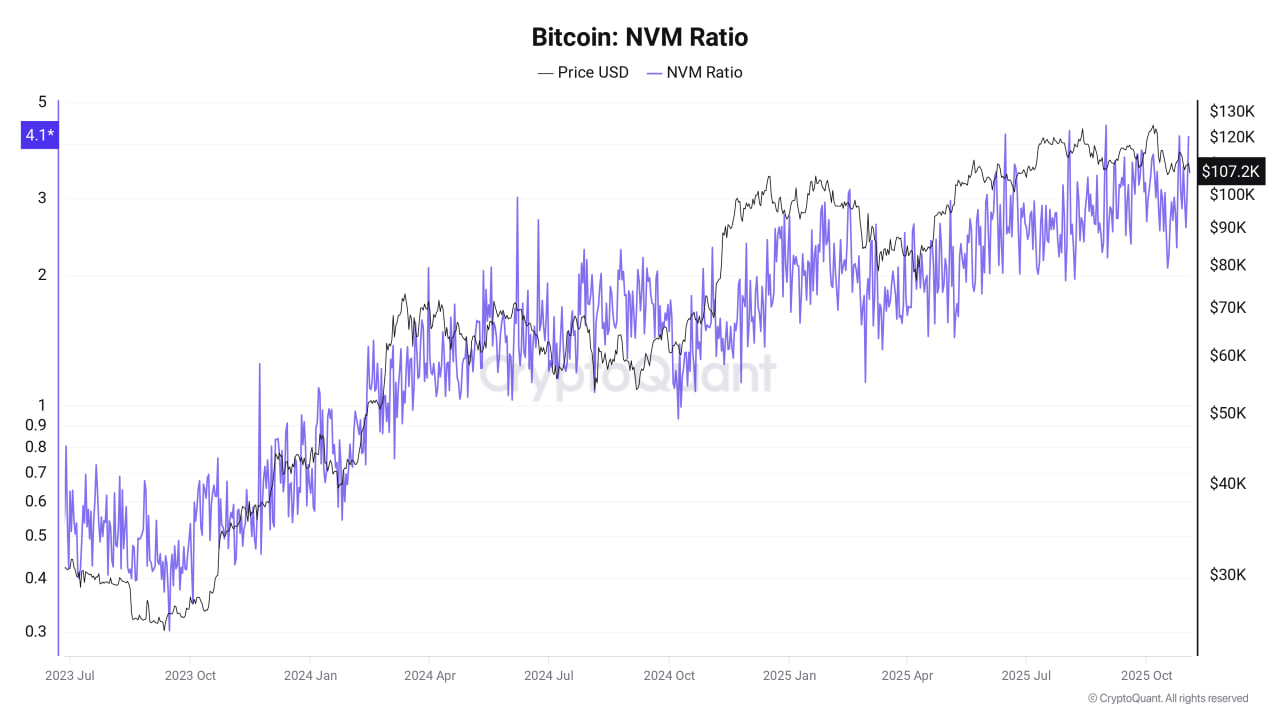
Researcher Pelin Ay adds that according to Metcalfe’s Law, Bitcoin is overvalued: the current NVM Ratio (price to network activity ratio) is 2.97, which is significantly above the historical norm.
‘When this indicator exceeds 2, the price usually corrects. According to the model, the nearest fair value is around $98.5K,’ she summarizes.
What’s next?
A drop below $105K could trigger a test of support at $101K and, if broken, a move to $98.5K. At the same time, many analysts expect a short-term rebound — especially if the level of fear in the market peaks.
The seasonal factor and the possible end of QT give a chance for recovery in the medium term. But in the short term, the market looks vulnerable, and investor sentiment remains cautious.
Read more: Balancer hack: losses exceeded $116 million, the team offers a 20% reward for the return of funds


